"There is no such thing as information overload. There is only bad design." A famous saying by Edward Tufte American statistician. Well said, isn't it...
"There is no such thing as information overload. There is only bad design." A famous saying by Edward Tufte American statistician. Well said, isn't it? Okay, I have another quote from Paul Rand, an American art director, and that is "Design is the silent ambassadors of your brand."
Now, the question is why I am telling you about this. Doesn't make any sense, Right?
Do me a favor, just combined those two quotes. What will be the possible output? Any guesses?
Okay. It will be Infographic. A great way of visually attractive representations of information and capturing the desired attention for your brand. A creative way to put a thousand words and depict them using a picture.
Readers are always looking for quick access to information, and that's why there's been plenty of infographic creators and free infographic makers on the internet now. However, to make things easy for you here we come with a list of the best infographic makers.
Let's check um.
Read also: How Infographic and Effective Content Strategy can Boost Your Online Business
What is an Infographic and How to Create an Infographic?
Before digging in, it is required to know, what is infographic is? Also, how to make a good infographic?
Infographics are quick and precise graphic visual representations of information, data, images, and much more knowledge intended things. It can make thousand of information in an at a glance view position. Some important points to be noted,
- Get a quick overview of a topic
- Explain a complex process
- Summarize a long report
- Compare and contrast multiple options
Here's an example for you,

Nowadays, the solution for particular issues online is so common. Therefore, you have every solution there, then why not Infographic? There's been tons of infographic creators available on the internet now. Just choose one of them and follow the further instructions.
Canva Infographic Maker
"Design anything. Publish anywhere" The ultimate goal of Canva. Canva Infographic Maker is one of the best and the most used online design tool and infographic creators of recent times. Both designers and non-designers can easily make up any fresh design using Canva's drag-and-drop feature and professional layouts and creative stuff.
Therefore, to make an infographic, you will first need to choose your favored category from their immense collection. The whole process of creating an infographic with its menu and design elements is pretty simple based on your exact design need for any purpose.
The free plan of Canva is quite impressive in that you will get access to 300 000 photos and illustrations, unlimited folders, sharing and resizing options with 30 days free trial.
Features of Canva
- Stock images and illustrations
- Social media graphics
- Library of fonts
- Drag & drop editor
- Custom templates
- Customizable branding
- Photo editing
- Resize designs
- Photo filters
- Stock vectors & photographs
- Icons, shapes & elements
- Multiple document types
- Graphs, mind maps, charts, & diagrams
Pricing
- Free: With 30 days of free trial.
- Pro: $9.95 per month if billed yearly. $12.95 per team member if billed monthly.
Piktochart
Piktochart is a multi-format-based just a simple, intuitive tool that helps you and your team to make infographics, presentations, posters, reports, and flayers with the visual impact they deserve without the complexity and no substantial designer fees.
You can select your preferred templates from their directory or create your own infographic for any purpose like social media infographic, real estate infographic, business plan infographic. After selecting any template, you can simply drag and drop to add any graphic elements and text to your canvas also upload your own images.
Piktochart has more than 400 fully customizable themes with objects, graphs, retina-ready images, and colors that you can edit and adjust as your preference; Therefore, some are free, and others require Lite or Pro plan.
Features of Piktochart
- Charts and maps
- Design flexibility
- High-res downloads
- Functional innovation
- Ready to use graphics
- Variety of banner types
- Export as different file types
Pricing
- Free: With 30 days of free trial.
Piktochart Package:
- Pro: $24.17 per month & Charging $290 a year.
- Pro Team: $43.33 per month for 2 members & Charging $520 a year.
Education & Nonprofit:
- Individual Pro: $39.99 per year.
- Pro Team: $79.98 for 2 members per year.
Infogram
Infogram infographic is an intuitive visualization tool giving anyone the power to visualize and share data in minutes. Create rich content and simple infographics from complex data sets. It is best for number and data lovers yet a limited choice for artistic perspective.
The making process is just some easy steps of work: sign up first, pick a template, visualize the data, and publish it. Infogram is one of the best options when dealing with statistics, graphs, and maps.
Compared to 550+ for the premium versions elements, you can use only a limited number of interactive charts types and maps types with the free version. The feature increases cordially with the pro plan.
Features of Infogram
- Customizable premium themes and layouts
- 1 million+ royalty-free images
- Drag-and-drop editor
- Data import from spreadsheets & cloud services
- Multi-format visualization exports
- Interactive dashboards, reports & charts
- Engagement analytics
- Real-time data import
- More than 35 chart types
- Different map types
- different library size
Pricing
- Basic plan: Free forever with free trial.
- Pro plan: $25 per month. $19 per month if billed yearly.
- Business plan: $79 per month. $67 per month if billed yearly.
- Team plan: $179 per month. $149 per month if billed yearly.
- Enterprise plan: By quote.
VistaCreate
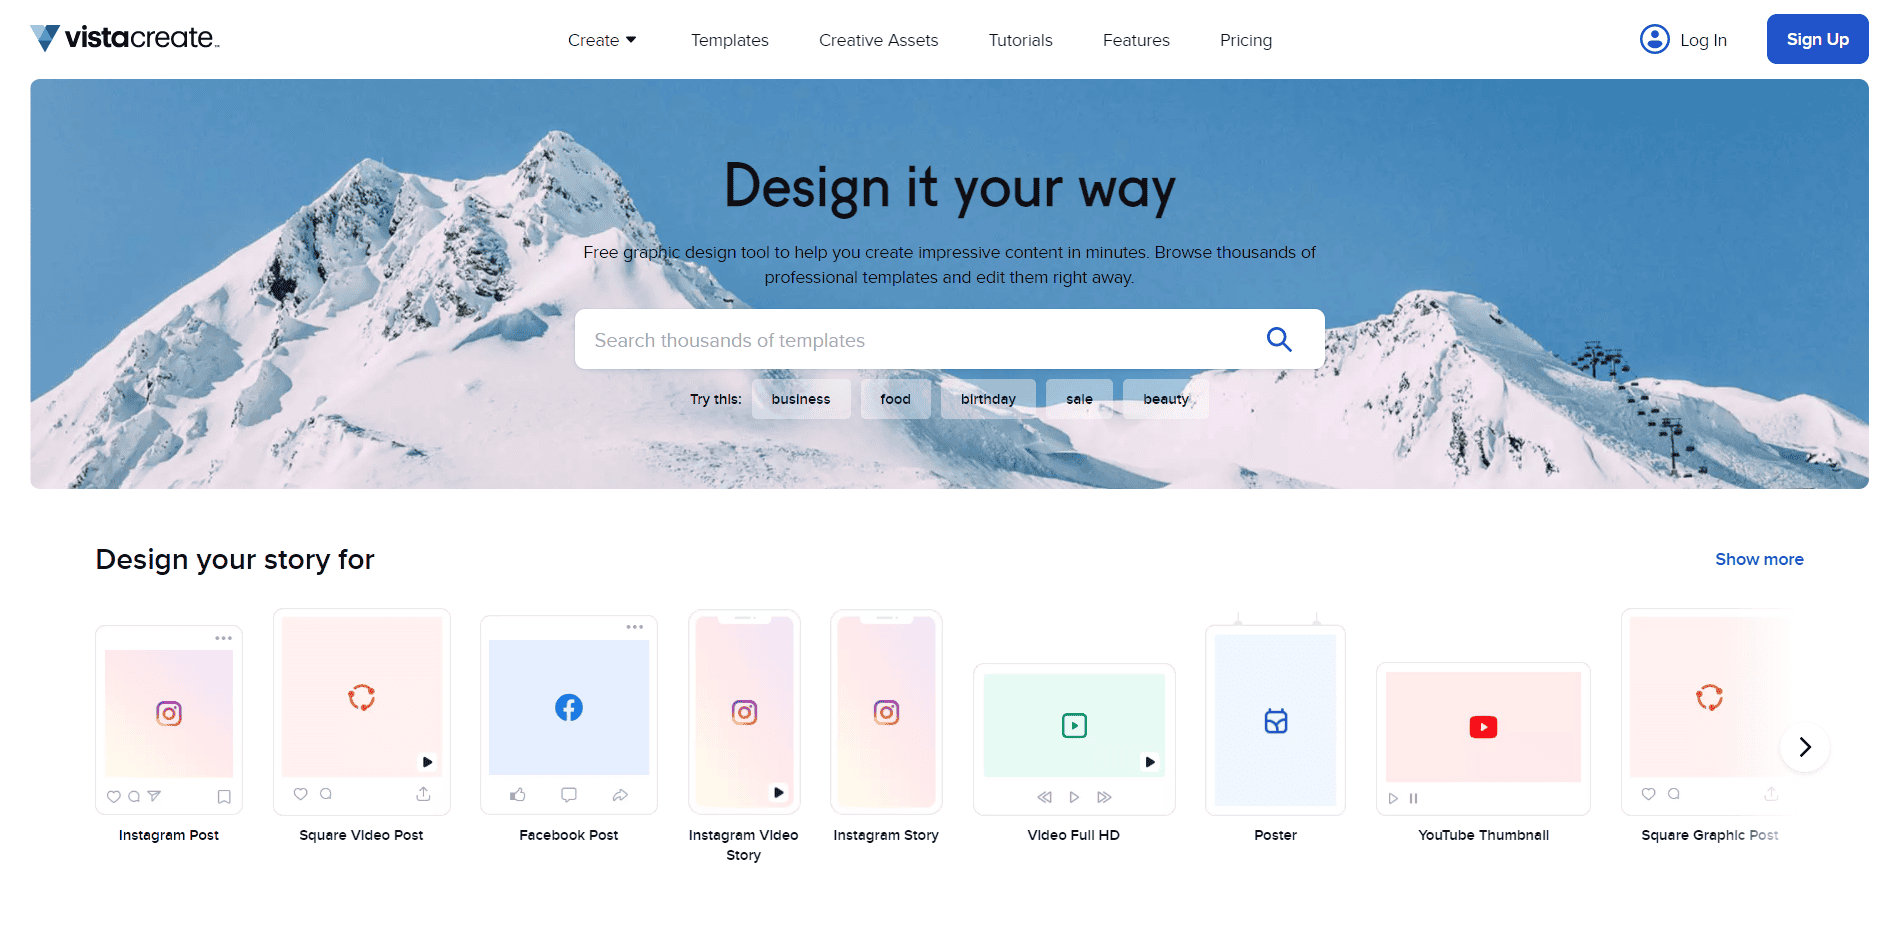
Nobody is interested in boring tables and lists anymore. Present your information with beautiful and engaging infographics from VistaCreateeasily than ever before. Switch to any of the professional templates or create designs from the scratch. You have all the necessary tools and objects at your fingertips.
Even if you are a beginner, you will definitely succeed. Crello has a huge library of free objects. This simplifies the process of creating high-quality infographics. And when the project is completed, you can save it in the app as well.
Read also: How to Make Infographics With VistaCreate in 5 Simple Steps
Features
- Large library with photos and videos
- Animated objects and backgrounds that could be added to any template
- Free effects for graphics and a possibility to edit them
- Extra icons, stickers, figures, masks, frames, lines, etc.
- The functions and tools are being constantly improved.
Pricing
- Starter: Free
- Crello Pro: 7.99$ per month
Easel.ly
Easel.ly is another best free infographic maker and the only infographic tool that comes with a dedicated design team. You can visualize almost any kind of information with it, and that's why 3 million people have created infographics with Easel.ly already.
First, you need to pick a ready template from a long list of already made ones, then you can add in shapes, backgrounds, charts, and a search bar and drop-down menu on the side will let you filter the template results.
You don't require an account to create an infographic even you will be able to download your finished infographic for free. However, Easel.ly provides attractive pricing plans with lots of additional features.
Features of Easel.ly
- Different types of infographics
- Add your preferred objects
- Change background and background-color
- Add shapes and control their opacity
- Text menu
- Dynamic charts
- Upload scalable vector Graphics, PNG, and other image file formats
- Grid view
- Share and reuse infographics
- Group share with a shareable link
- Access thousands of infographic design templates and images
- Support from professional designers
Pricing
- Basic plan: Free.
- Pro plan: $4 per month.
- Enterprise: By quote.
- Students: 50% off. $2 per month.
Venngage
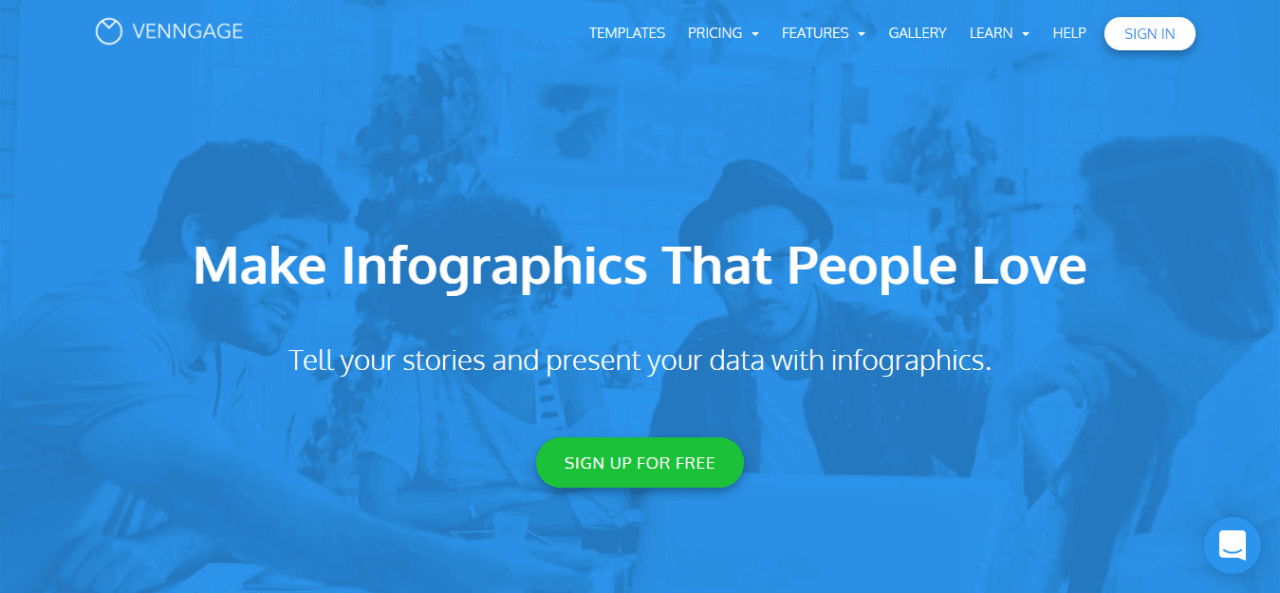
Venngage infographic creator, one of the best free infographic makers, offers you very few different options to pick from in terms of what it is you want to create before signing in. You can choose your favored one from hundreds of professional templates for things like posters, promotions, reports, and of course, infographics.
You can start creating your infographic design and can tell your story visually by adding (What they call Widget) text sections, icons, charts, maps, photos, and many more resources. It's a simple 3 step process.
Some of the resources are for premium use; therefore, you need to upgrade your plan in order to use them. Free pan covers 5 images per month, but the premium plan gives you access to 50 premium templates and assets with it.
Features of Venngage
- Business and premium templates
- Custom templates
- Unlimited infographics
- 100 image uploads
- Add multiple pages
- Premium charts
- Premium icons and charts
- Privacy controls
- Team sharing and collaboration
- Export PDF, PNG, Hi-Res PNG, and interactive PDF PDFS
- Unlimited support
Pricing
- Free: For students.
- Business: $49 per month for business organization.
- Premium: $19 per month for an individual.
DesignCap Infographic Maker
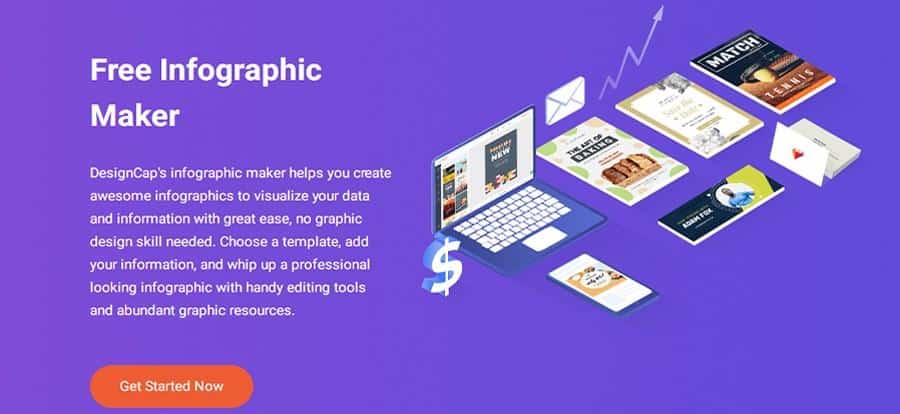
DesignCap Infographic Maker is an incredibly powerful visualization tool for anyone, very friendly for non-designers. You'll find an extensive collection of templates, charts, modules, preset fonts, icons, backgrounds, and millions of stock photos.
The editor is more versatile and has many more features. You can begin the design with a template or start from scratch. Then you can change any text, delete any picture or move any icon according to your needs. Feel free to add your photos, charts, graphics, and other elements. You can group and lock items to make editing easier for a massive infographic.
The comprehensive Chart tool helps you add visualizations in a dozen different styles directly in the infographic. DesignCap allows you to import data directly from files of XLS, XLSX, and CSV. Then edit the styles and their placement. Infographics are not the only thing that DesignCap can do well. With DesignCap, you can create other designs like presentations, reports, social media graphics, etc. without effort.
Features of DesignCap Infographic Maker
- Various template topics for of infographics
- Millions of stock images
- As easy as drop & drag thing
- Different chart types and dynamic maps
- Multi-format artwork exports
- Adjust background with a color, preset pattern and custom image
- A collection of shapes and millions of icons
- A library of preset fonts
- Data import from spreadsheets
- A vast selection of modules
- Convenient cloud features
- High-resolution downloads
- Export as different file types
- Share to social media or anywhere with a shareable link
Pricing
- Free Plan: FREE of charge.
- Basic Plan: $4.99 per month if billed yearly. $8.99 per month if billed monthly.
- Plus Plan: $5.99 per month if billed yearly. $12.99 per month if billed monthly.
Final Word
These were the list guys for the best free infographic maker. Which one is your favorite, let me know in the comment section below. And don't forget to share your opinion regarding this list. We always valued your opinion.