As a webmaster of Joomla or WordPress websites, willing to make their pages even more engaging and convertible, you might want to include infographics...
As a webmaster of Joomla or WordPress websites, willing to make their pages even more engaging and convertible, you might want to include infographics creation in your content plan.
Indeed, the benefits of this format are many:
- A well-designed infographic increases engagement. (That's because the human brain processes visuals 60,000 times faster and better than text.)
- Infographics enhance SEO. (More "likable" and "shareable," this content format drives more traffic and backlinks to your website, influencing Google's algorithms.)
- It saves time on content creation and can skyrocket your website's conversion. (Rather than writing long texts for your blog, you can quickly visualize all the information you wanted to share with the target audience and motivate them to choose you over the competition.)
And now, for the most interesting part,
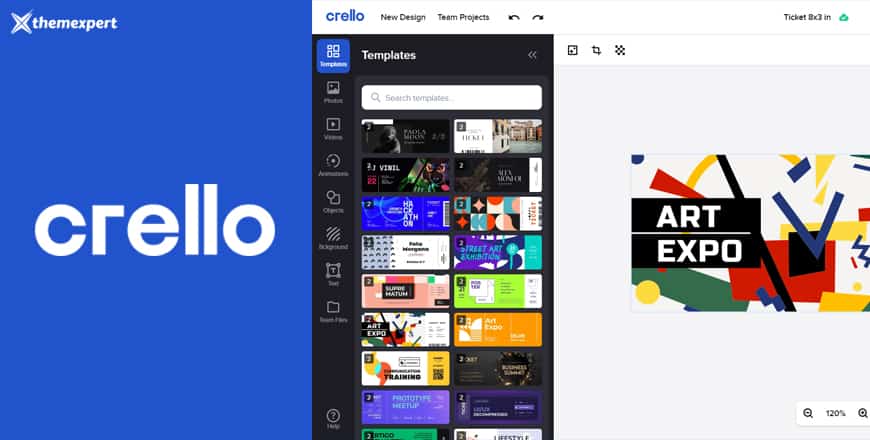
There's no need to be a graphic or web designer to make beautiful and relevant infographics for your website. A free online design tool and infographic maker, Crello (Now VistaCreate) does all the work for you in five simple steps.
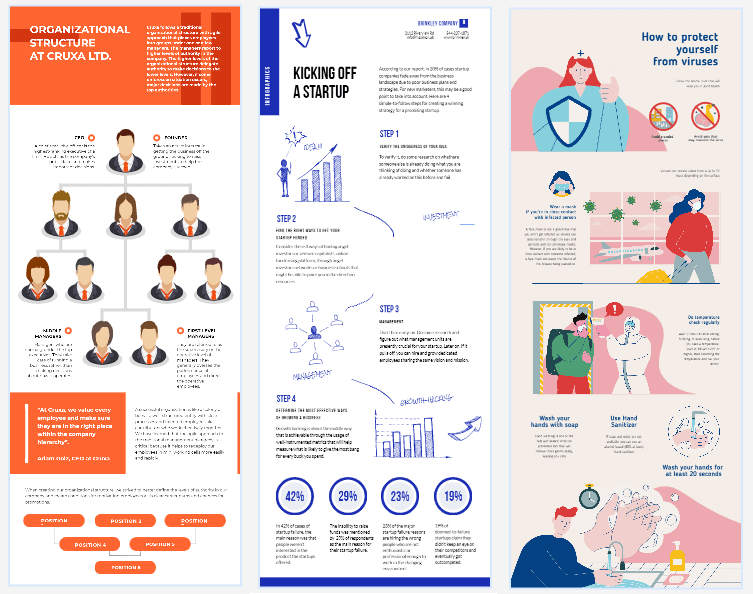
1. Choose A Customizable Template
Your goals for creating an infographic may be different:
- Overview an exciting topic
- Explain some complex processes to the audience
- Display survey data and your research findings
- Visualize the comparison of several options
- Summarize a long blog post or report in a more readable format
Depending on the goal and the data you're going to visualize in your infographic, your first step would be to visit Crello's (Now VistaCreate) extensive library of layouts or pre-designed infographic templates and pick the one fitting your content needs most.
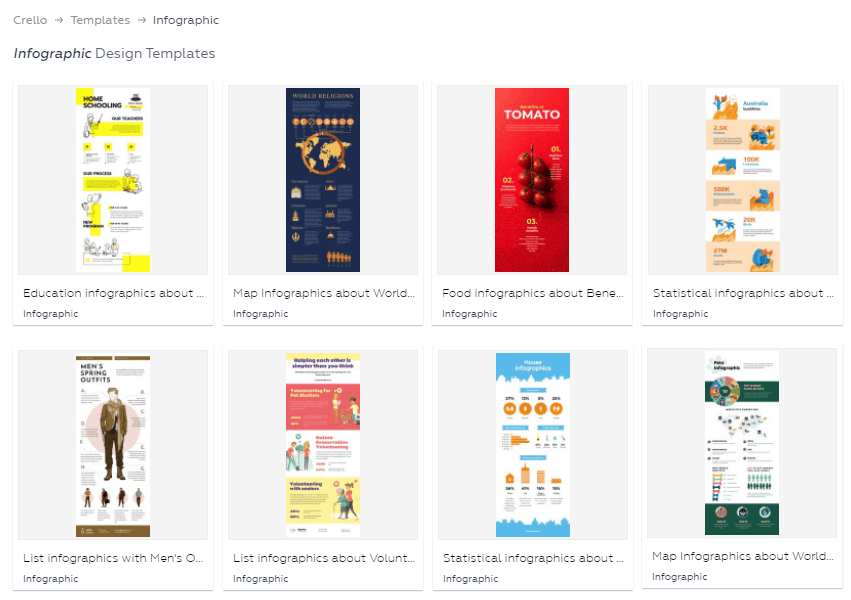
All the templates are customizable, so you'll be able to design each whatever you want. Feel free to choose among all the major types of infographics: lists, statistics, maps, timelines, comparisons, processes, and more.
If you don't notice a desired template in the Crello (Now VistaCreate) artboard at once, please use the search bar to specify the options or consider a specific category of infographics to narrow down the choice.
2. Embellish with Design Objects
Once you've picked the best template for visualizing your data, you are welcome to use Crello's (Now VistaCreate) build-in library of design elements to embellish your infographic with all the necessary objects.
These objects are many: shapes, lines, icons, illustrations, stickers, and thousands of other elements. Also, you can add videos and animations to your infographic if it suits your requirements and mood. Quick access to the library of design objects from your artboard in Crello (Now VistaCreate) makes the process of infographic creation as easy as possible.
Choose design options that suit the goals of your infographic:
- If you want to inform users about something, use icons, illustrations, large colorful texts, pictographs, timelines, etc.
- Consider charts of all types (bar, column, bubble, pie, treemap, stacked area, and more) for comparisons.
- If you need to organize information, choose lists, mind maps, flowcharts, or tables.
In Crello (Now VistaCreate), you can choose templates with different layouts that will help create natural information flow and structure all the data in a balanced way:
Use a single-column design for a linear flow, two-column – for comparisons, and a multi-section layout – for infographics where reading order isn't that critical.
3. Upload Own Content Whenever Required
It's hard to imagine, but if you've sifted through Crello's (Now VistaCreate) massive library of design objects and couldn't find what you were looking for, here goes an alternative option for you:
Upload your own content there!
Crello (Now VistaCreate) allows you to upload photos, illustrations, videos, and fonts. The tool will add your files to the library, and then you'll be able to customize their dimensions so they would perfectly fit the canvas.
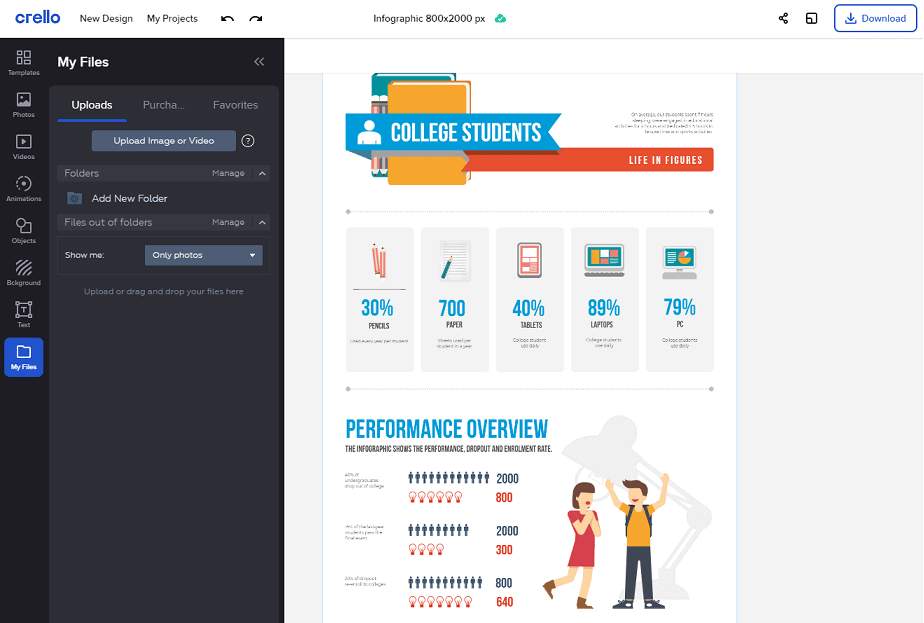
Also, you can change the colors of your uploaded content to give your infographic some visual interest. Now your design will be original for sure! But please keep the colors, size, and style of all the visual elements consistent so that your infographic would look visually appealing.
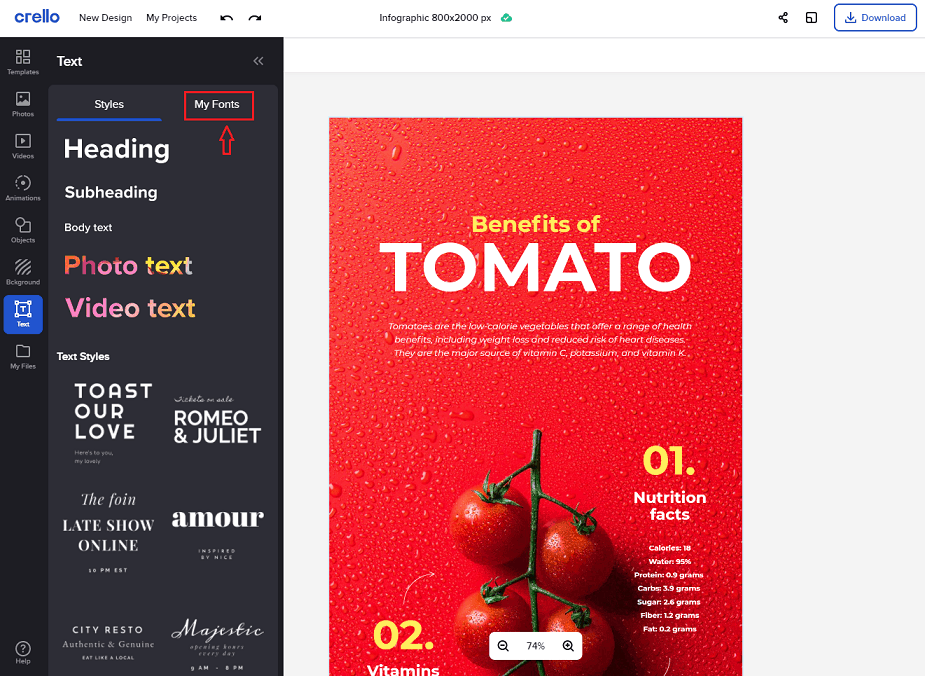
4. Play with Fonts
Have you heard anything about font psychology?
It appears that the fonts you choose for your website content influence readers' perceptions and impact their thoughts, feelings, and associations. That is why designers pay so much attention to the size, weight, spacing, and shape of fonts they choose for brand logos, taglines, and marketing materials.
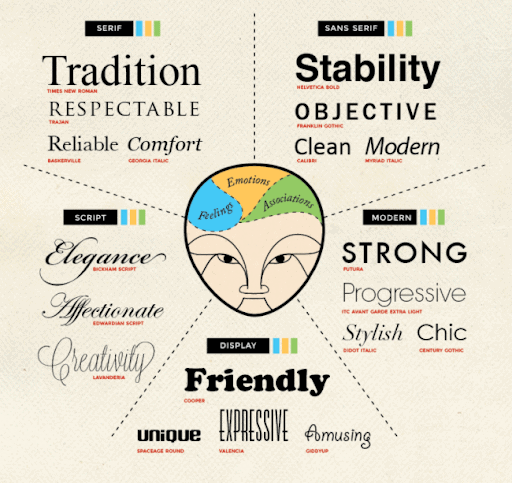
The fonts you use for an infographic also matter because they influence readability and associations users will build while reading it.
Crello (Now VistaCreate) offers over 300 fonts of different shapes and sizes for you to pick the most appropriate ones for your infographic. So, after you've added all the design objects to your layout, it's time to supplement them with text.
For the infographic to look trendy and compelling, do your best to keep its text content simple. Think of it as a visual summary, and use text only if it's crucial for understanding your concepts.
Try to keep paragraphs short and use the words everyone will understand. (No slang, professional jargon, abbreviations, or technical terms, please.)
Choose a readable font for your infographic texts, and align the size and style of your headings, subheadings, and data highlights so that your overall design would look apparent.
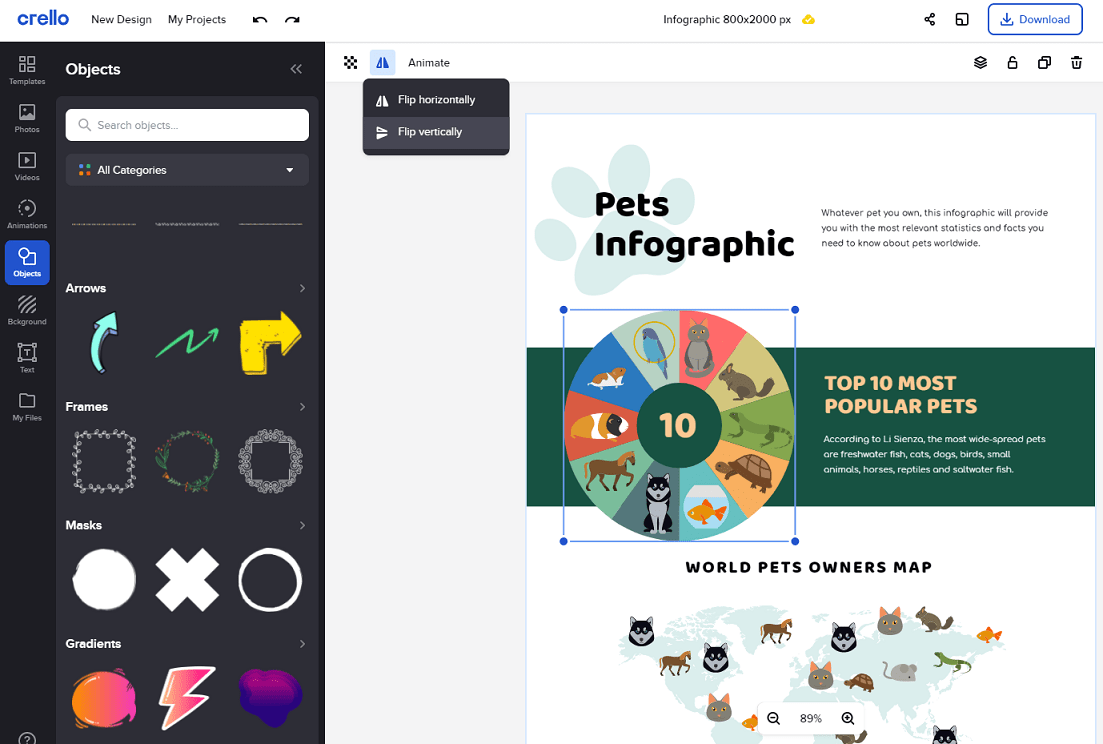
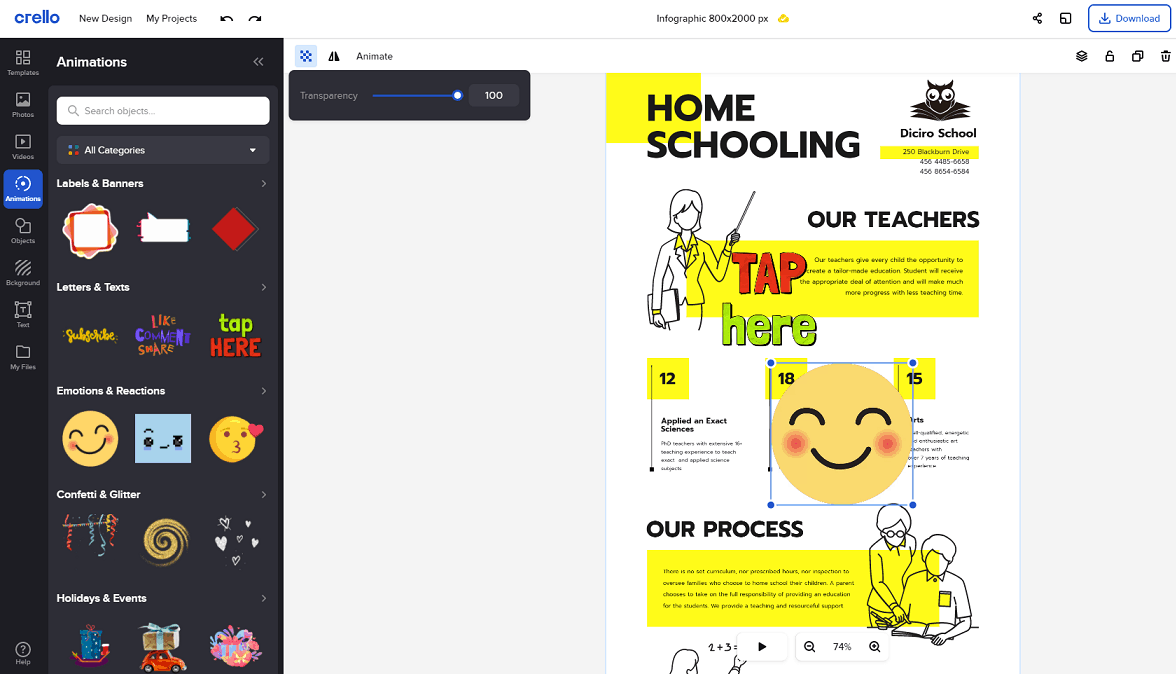
5. Animate Your Infographic for Better Engagement
Branded animation and interactive elements in infographics are among the top graphic design trends of 2020. Crello (Now VistaCreate) goes with the time, allowing users to apply animated effects to text blocks and images for emphasizing the elements that need the most attention.
Animations are more eye-catching, allowing you to grab people's interest in your content and promote it more efficiently on social media and other marketing platforms.
In Crello (Now VistaCreate), feel free to animate frames, texts, emoticons, 3D objects, charts, and illustrations of your infographic. But whatever you animate, please ensure that all the elements look aligned and natural within your overall design. You don't want to make the audience's eyes bleed, do you?
Long Story Short: Here's How to Make Infographics with Crello in Five Steps
- Choose a layout or ready-made template.
- Customize it with all the design objects you need.
- Upload own design elements if required.
- Pick the fonts and adjust them for better readability.
- Add animated content to your infographic for better engagement.
And once your infographic is ready, feel free to download it to the computer and publish at your website later, or share it on social media right away, directly from the Crello (Now VistaCreate) interface.
Your Turn
Among the tons of free infographic makers available for Joomla and WordPress users today, Crello (Now VistaCreate) appears to be one of the most multi-functional yet super easy-in-use. Why not sign up for it today (it's free!) and get the most out of their features for your website's content success?
And which one is your favorite infographic maker? Or, maybe you prefer not using this content format on your website? Don't hesitate to share your thoughts in the comments below.
About Author: Forhad Mollah is a professional content strategist who has been creating SEO-friendly engaging web content for so long.