
Polymer
No-code AI business intelligence and dashboards
A no-code AI business intelligence tool that transforms spreadsheets and marketing data sources into searchable, interactive stakeholder dashboards.
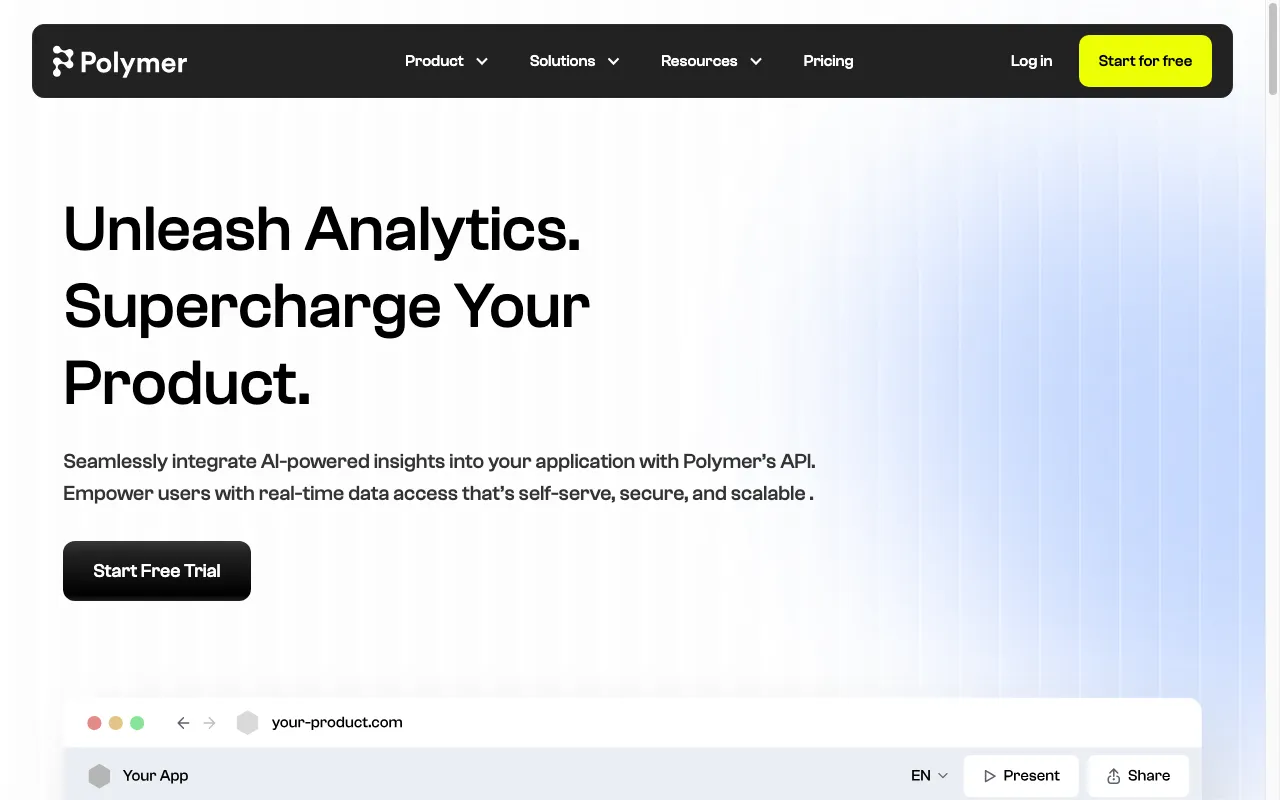
Polymer turns static spreadsheets and marketing data streams into interactive, searchable business intelligence dashboards in minutes. Unlike traditional BI tools that require configuring complex schemas and writing SQL queries, Polymer automatically analyzes uploaded columns and generates a full suite of pivot tables, bar charts, and relationship graphs.
The interface functions like an interactive e-commerce filter for your data: stakeholders can click tags, filter ranges, and cross-examine metrics without breaking formulas or asking an engineer for report revisions. Built-in AI assistants detect anomalies and summarize key performance drivers in plain English.
For digital agencies and small businesses that need to share transparent performance metrics with clients without investing in heavy enterprise BI infrastructure, Polymer provides a lightweight, highly visual solution.
Features
Instant Auto-Dashboard Generation
Analyzes uploaded data columns and auto-builds interactive charts and pivot summaries.
Natural Language AI Insights
Ask conversational questions to filter datasets and uncover hidden correlations.
Embeddable Data Apps
Embed interactive, filterable dashboards directly into client portals and websites.
Multi-Source Connectors
Native sync with Google Sheets, Excel, Airtable, Shopify, Facebook Ads, and Google Ads.
Use cases
- Building client-facing marketing analytics dashboards without writing SQL
- Creating searchable e-commerce inventory and sales performance portals
- Analyzing user survey responses and categorical feedback datasets
- Sharing interactive financial summaries with non-technical stakeholders
Compare Polymer head to head
Side-by-side comparisons, on pricing, platforms and where each one wins.















Looking for something similar?
Other data & analytics tools worth comparing against Polymer.